SmartCrane SpeedThough™ Software
USING HISTORICAL DATA TO PREDICT WHEN AN INDIVIDUAL CONTAINER WILL BE CALLED FOR
SmartCrane SpeedThough™ Software
USING HISTORICAL DATA TO PREDICT WHEN AN INDIVIDUAL CONTAINER WILL BE CALLED FOR
Software Summary
This software application predicts dwell times for import containers at a marine terminal. Dwell times are then added to release time to predict which import containers will leave the terminal on the following day (or any other future interval). This information allows crews to relocate high-probability containers to a staging area close to a truck transfer station.
Every transfer from the staging area will have a shorter cycle time because of the reduced distance from the box to the truck zone as compared to the average distance of a container from the normal import stacks.
The software operates solely from historical data and does not require inputs from truck operators, shippers, or terminal clerks. It can be employed by itself or as a companion to a mandatory or volunteer reservation system.
The application can also help smooth gate arrivals by alerting terminal operators to potential gate congestion at specific future times. Terminal staff can reduce congestion by delaying the release of specific containers.
The application is written in common computer language and can be converted to any host and tested in a cooperative by terminal IT staff and SmartCrane LLC personnel. Evaluation by terminal operations personnel can then follow.
How SpeedThrough™ Works
Extracting Statistics
For analysis, we collect and calculate data in groups. SpeedThrough uses a common data structure for any collection of events, which includes all relevant data elements as discussed above.
After extracting the data, we first set all the discriminators off (meaning all events data are in one large collection) and then run all the history records through a set of proprietary analysis routines.
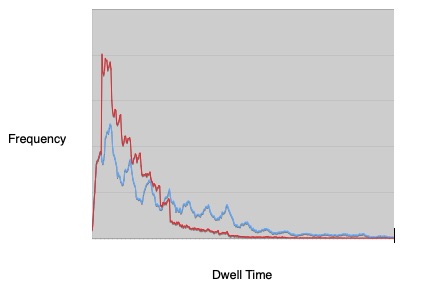
The first important indicator from this analysis is the distribution of dwell time, both gross and net. The first figure shows a typical dwell time distribution. Gross dwell time is in blue and net is in red.
Bayesian Analysis
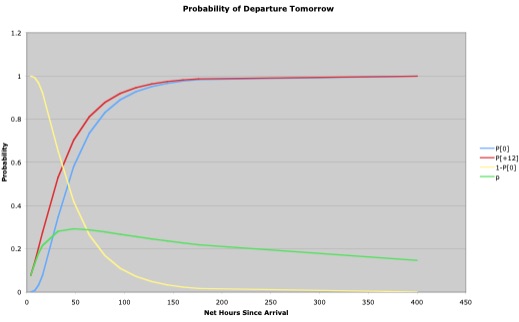
Next we generate the probability that a particular container will depart the next day. This probability p is small just after a container’s arrival and increases until it reaches a maximum and decreases as the dwell increases beyond that point. The graph in the next figure shows the relationships among P{+12}, P{+0}, 1-P{+0}, and p, for one example mean and variance. The green curve shows that the daily departure probability increases in the beginning, reaching a peak, and then declines over time. This represents the real experience that if a container is not picked up early, the likelihood of it becoming a “stale” box increases with time.
Benefits
Predictive analytics helps terminal operators better prepare for a new day’s activities, in many ways, with important potential benefits. These are the same benefits offered by implementing a strict truck appointment system, without the expense and imposition on its trucking customers.
Reduced Truck Wait Time
When a container has been staged or groomed in preparation for truck arrival, fetch time is reduced, resulting in shorter truck wait times.
Better Equipment Utilization
Sometimes during a shift, container-handling equipment can become idle because of lack of immediate demand. Having a backlog of staging or grooming moves gainfully employs the idle equipment.
Reduced Cost
If shift labor can be adjusted day by day, having a prediction of potential truck arrivals may allow terminal operators to better plan personnel assignments.
Reduced Congestion
The daily predictions can alert a terminal operator when much higher than normal truck activity is likely to occur. In such cases, operators may delay notifying customers of ready containers, thus avoiding overcapacity situations and long truck lines.
